1.9 KiB
1.9 KiB
Visualizing representations with t-SNE
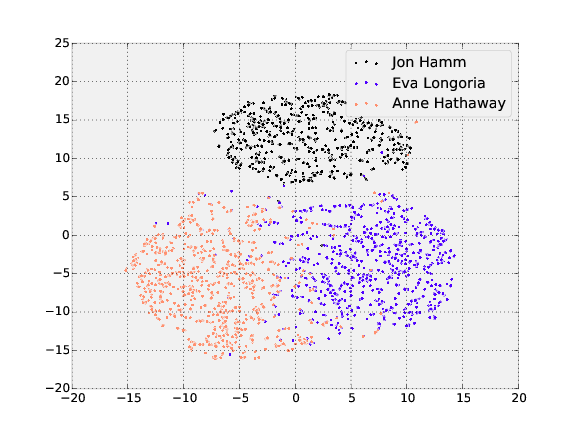
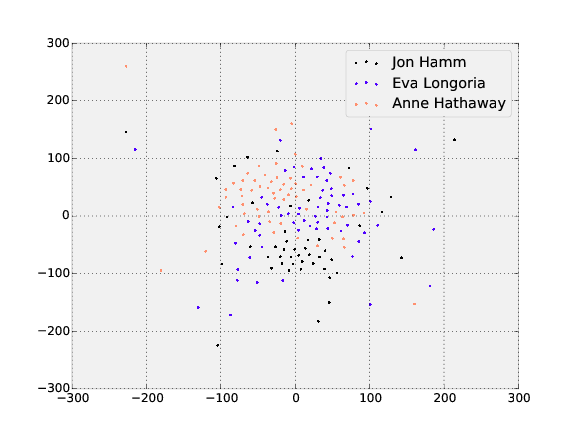
t-SNE is a dimensionality reduction technique that can be used to visualize the 128-dimensional features OpenFace produces. The following shows the visualization of the three people in the training and testing dataset with the most images.
Training
Testing
These can be generated with the following commands from the root
openface directory.
- Install prerequisites as below.
- Preprocess the raw
lfwimages, change8to however many separate processes you want to run:for N in {1..8}; do ./util/align-dlib.py <path-to-raw-data> align affine <path-to-aligned-data> --size 96 &; done. - Generate representations with
./batch-represent/main.lua -outDir <feature-directory (to be created)> -model models/openface/nn4.v1.t7 -data <path-to-aligned-data> - Generate t-SNE visualization with
./util/tsne.py <feature-directory> --names <name 1> ... <name n>This createstsne.pdfin<feature-directory>.
Visualizing layer outputs
Visualizing the output feature maps of each layer is sometimes helpful to understand what features the network has learned to extract. With faces, the locations of the eyes, nose, and mouth should play an important role.
demos/vis-outputs.lua outputs the feature maps from an aligned image. The following shows the first 39 filters of the first convolutional layer on two images of John Lennon.


