|
|
||
|---|---|---|
| demo | ||
| .gitignore | ||
| README.md | ||
| average.go | ||
| average_test.go | ||
| data.go | ||
| expvars.go | ||
| expvars.json | ||
| expvars_advanced.json | ||
| expvars_test.go | ||
| histogram.go | ||
| main.go | ||
| self.go | ||
| service.go | ||
| stack.go | ||
| stack_test.go | ||
| stat.go | ||
| ui.go | ||
| ui_dummy.go | ||
| ui_multi.go | ||
| ui_single.go | ||
| utils.go | ||
| utils_test.go | ||
| var.go | ||
| var_test.go | ||
README.md
ExpvarMon
TermUI based Go apps monitor using expvars variables (/debug/vars). Quickest way to monitor your Go app.
Introduction
Go apps console monitoring tool. Minimal configuration efforts. Quick and easy monitoring solution for one or multiple services.
Features
- Single- and multi-apps mode
- Local and remote apps support
- HTTP and HTTPS endpoints, including Basic Auth support
- Arbitrary number of apps and vars to monitor (from 1 to 30+, depends on size of your terminal)
- Track restarted/failed apps
- Show maximum value
- Supports: Integer, float, duration, memory, string, bool, array variables
- Sparkline charts for integer, duration and memory data
- Auto-resize on font-size change or window resize
- Uses amazing TermUI library by gizak
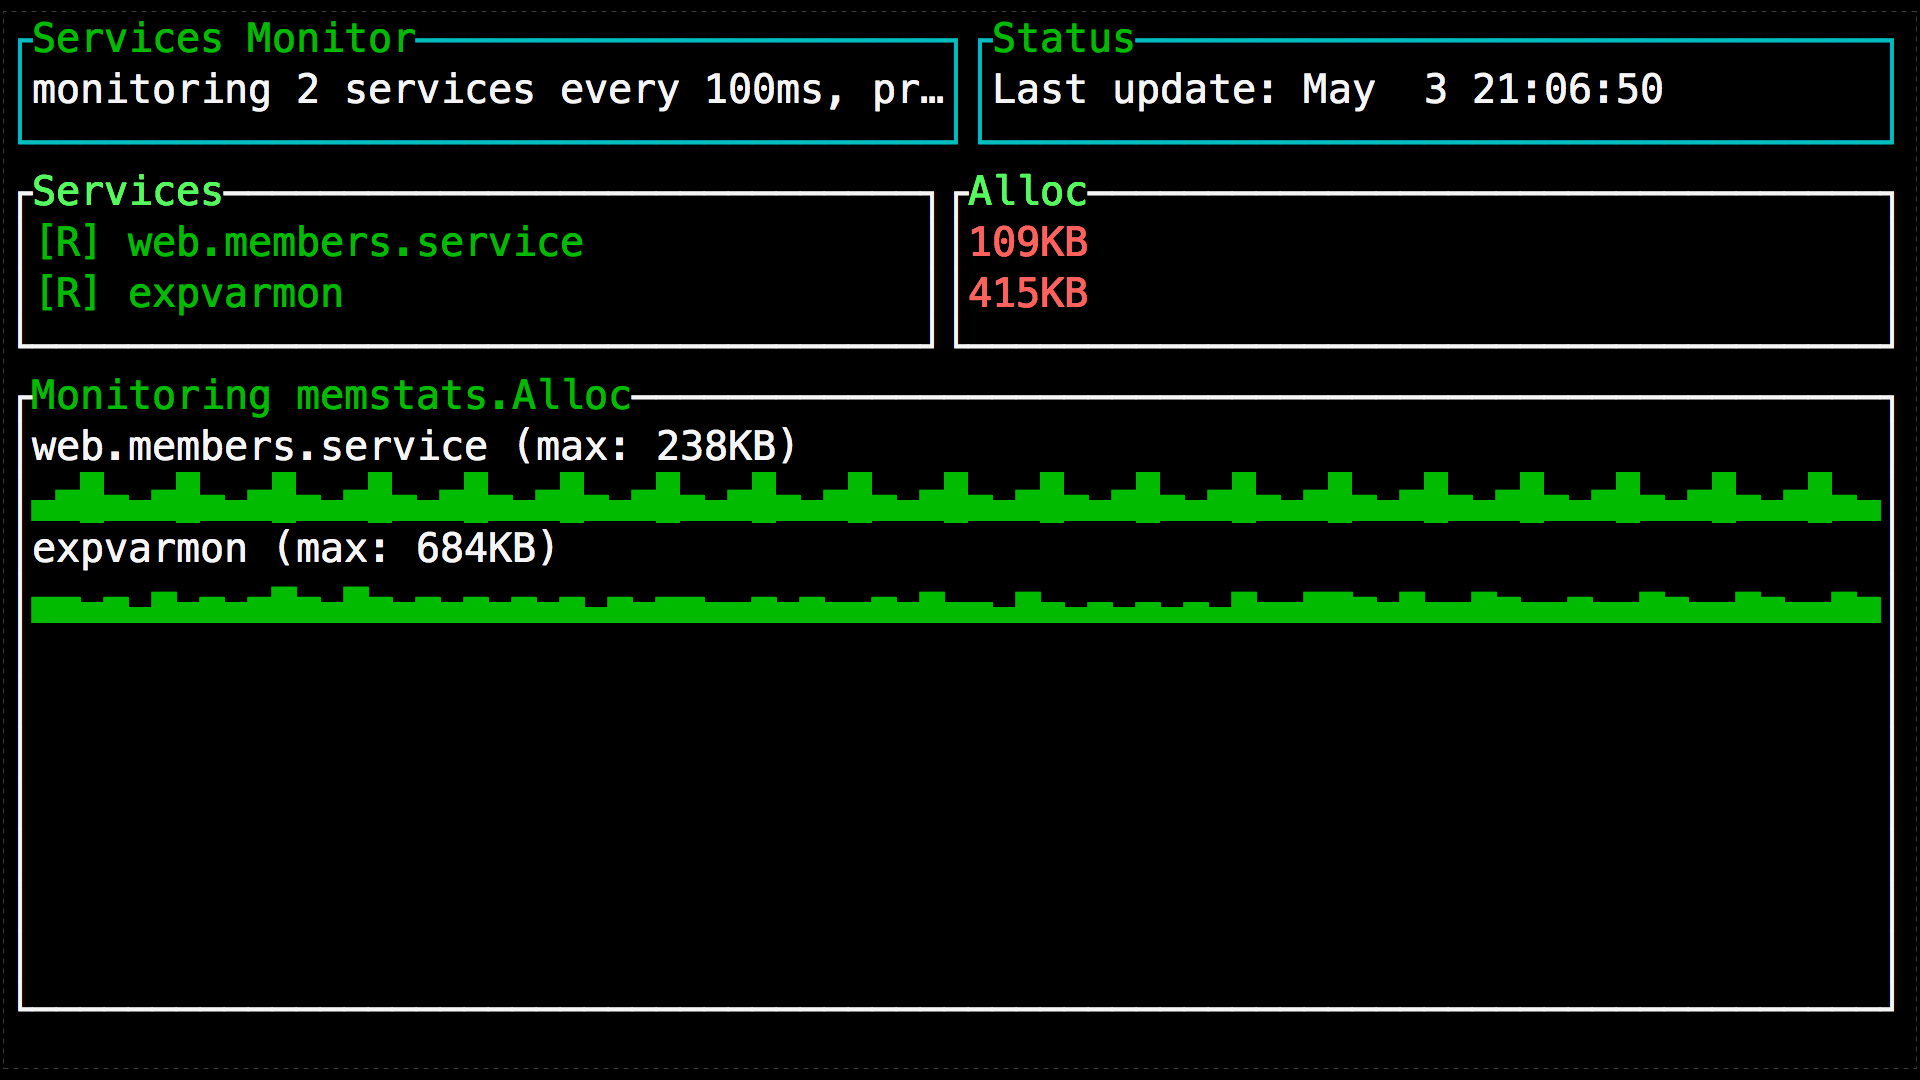
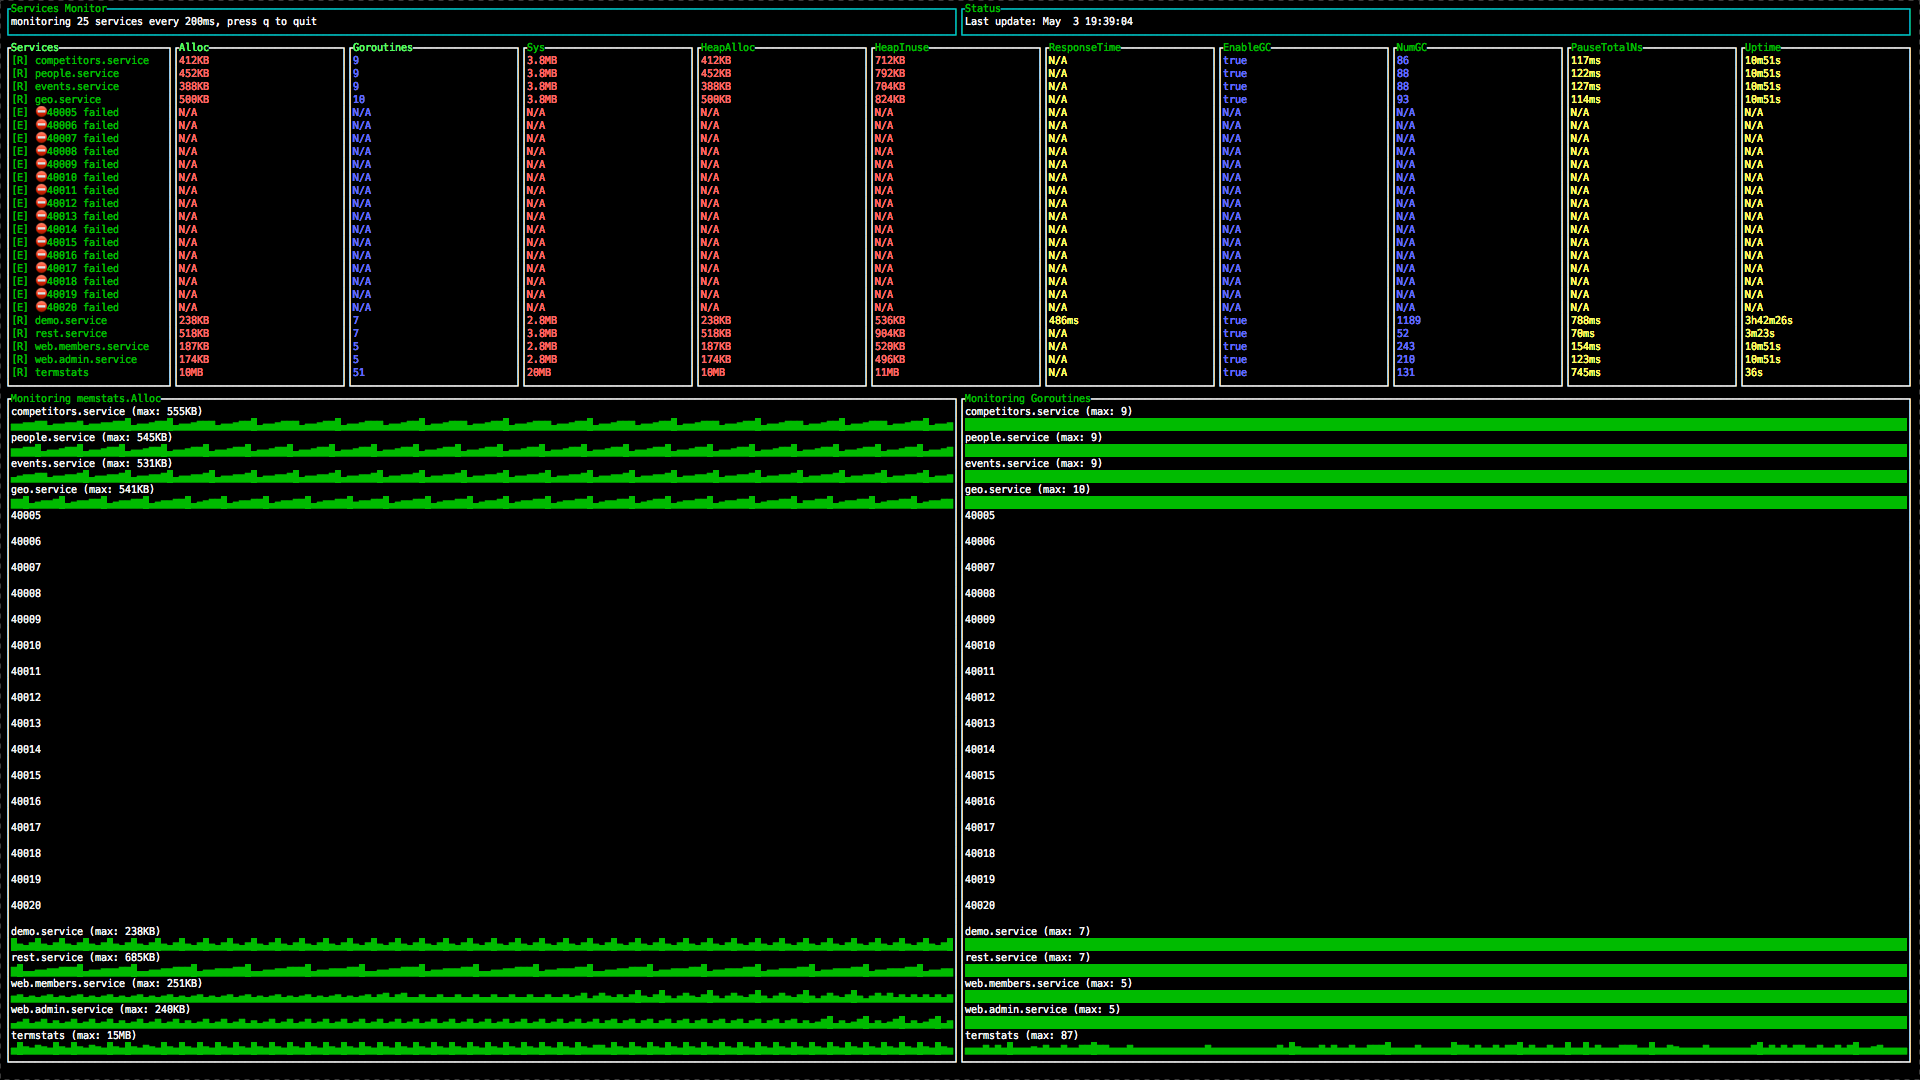
Demo
Multiple apps mode

Single app mode

You can monitor arbitrary number of services and variables:
Purpose
This app targets debug/develop sessions when you need an instant way to monitor you app(s). It's not intended to monitor apps in production. Also it doesn't use any storage engines and doesn't send notifications.
Install
Just run go get:
go get github.com/divan/expvarmon
Usage
Prepare your app
First, you have to add expvars support into your Go program. It's as simple as:
import _ "expvar"
and note the port your app is listening on. If it's not, just add two lines:
import "net/http"
...
http.ListenAndServe(":1234", nil)
and expvar will add handler for "localhost:1234/debug/vars" to your app.
By default, expvars adds two variables: memstats and cmdline. It's enough to monitor memory and garbage collector status in your app.
Run expvarmon
Just run expvarmon with -ports="1234" flag:
expvarmon -ports="1234"
That's it.
More examples:
./expvarmon -ports="80"
./expvarmon -ports="23000-23010,http://example.com:80-81" -i=1m
./expvarmon -ports="80,remoteapp:80" -vars="mem:memstats.Alloc,duration:Response.Mean,Counter"
./expvarmon -ports="1234-1236" -vars="Goroutines" -self
./expvarmon -ports="https://user:pass@my.remote.app.com:443" -vars="Goroutines" -self
Advanced usage
If you need to monitor more (or less) vars, you can specify them with -vars command line flag.
$ no ports specified. Use -ports arg to specify ports of Go apps to monitor
Usage of ./expvarmon:
  -dummy
    	Use dummy (console) output
  -endpoint string
    	URL endpoint for expvars (default "/debug/vars")
  -i duration
    	Polling interval (default 5s)
  -ports string
    	Ports/URLs for accessing services expvars (start-end,port2,port3,https://host:port)
  -self
    	Monitor itself
  -vars string
    	Vars to monitor (comma-separated) (default "mem:memstats.Alloc,mem:memstats.Sys,mem:memstats.HeapAlloc,mem:memstats.HeapInuse,duration:memstats.PauseNs,duration:memstats.PauseTotalNs")

Examples:
	./expvarmon -ports="80"
	./expvarmon -ports="23000-23010,http://example.com:80-81" -i=1m
	./expvarmon -ports="80,remoteapp:80" -vars="mem:memstats.Alloc,duration:Response.Mean,Counter"
	./expvarmon -ports="1234-1236" -vars="Goroutines" -self

For more details and docs, see README: http://github.com/divan/expvarmon
So, yes, you can specify multiple ports, using '-' for ranges, and specify fully-qualified URLs for remote apps. To override default URL endpoint ("/debug/vars"), use -endpoint flag.
You can also monitor expvarmon itself, using -self flag.
Basic Auth
If your expvar endpoint is protected by Basic Auth, you have two options:
- Set environmental variables HTTP_USER and HTTP_PASSWORD accordingly. These values will be applied to each endpoint.
- Embed your credentials to URL via command line flag:
-ports="http://user:pass@myapp:1234"
Vars
Expvarmon doesn't restrict you to monitor only memstats. You can publish your own counters and variables using expvar.Publish() method or using expvar wrappers libraries. Just pass your variables names as they appear in JSON to -var command line flag.
Notation is dot-separated, for example: memstats.Alloc for .MemStats.Alloc field. Quick link to runtime.MemStats documentation: http://golang.org/pkg/runtime/#MemStats
Expvar allows to export only basic types - structs, ints, floats, arrays (int or float), bools and strings. For arrays, average will be calculated. Ints are used for sparklines, and displayed as is. But you can specify modifier to make sure it will be rendered properly.
Vars are specified as a comma-separated list of var identifiers with (optional) modifiers.
| Modifier | Description |
|---|---|
| mem: | renders int64 as memory string (KB, MB, etc) |
| duration: | renders int64 as time.Duration (1s, 2ms, 12h23h) |
| str: | doesn't display sparklines chart for this value, just display as string |


